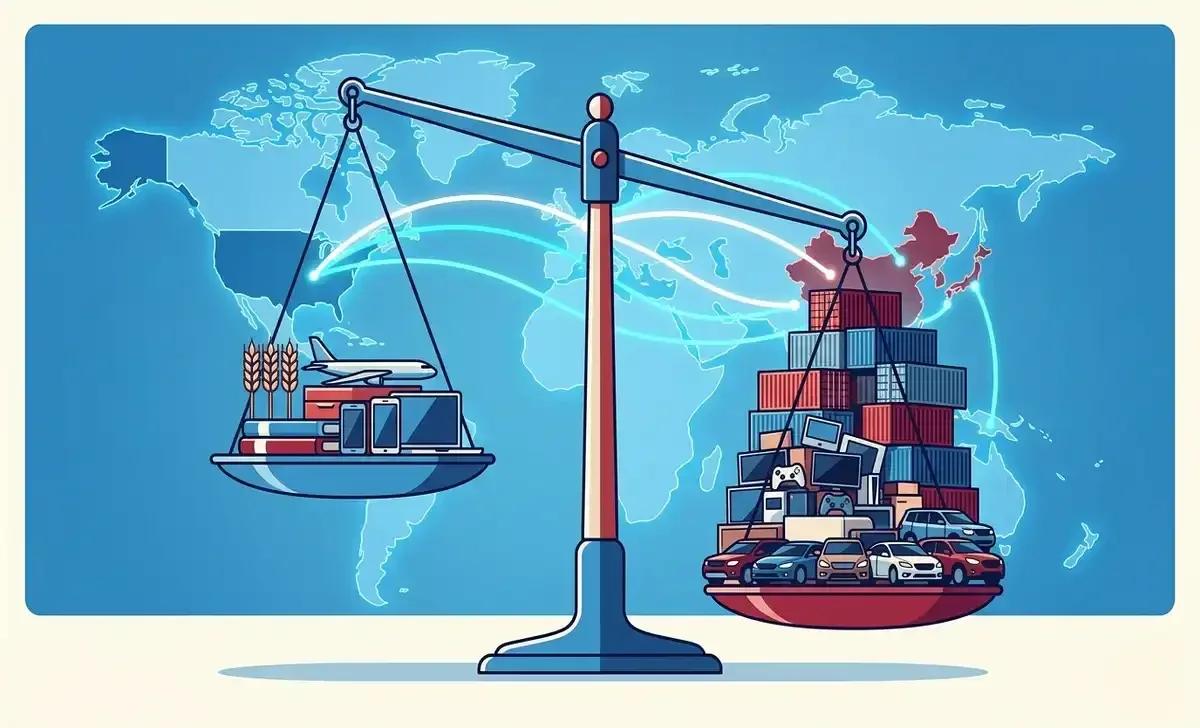
For decades, the US trade deficit only moved in one direction: up. Then 2026 broke that pattern. Year-to-date through April 2026, the goods and services deficit was down 49% compared to the same period in 2025 — driven by record exports and a sharp pullback in imports as new tariffs took hold. That reversal is now showing up in GDP data, in commodity prices, and in the political debate over trade policy.
This guide explains what the trade deficit actually measures, why it just had its biggest swing in years, which countries and industries matter most, and what it means if you're trying to understand where the US economy is headed.
What Is the US Trade Deficit?
The trade deficit (or "trade gap") is the difference between what the US buys from other countries and what it sells to them. When imports are larger than exports, the US runs a deficit; when exports are larger, it runs a surplus.
The headline number is actually two separate stories layered together:
- Goods deficit — the US imports far more physical products (electronics, vehicles, machinery, oil, clothing) than it exports. This is the part that dominates headlines and political debate.
- Services surplus — the US consistently exports more than it imports in finance, software, consulting, education, and intellectual property licensing.
The services surplus partially offsets the goods deficit, but has never been large enough to close the gap entirely.
A Concrete Example
Imagine April 2026 as a single household budget for the country: the US exported $327.1 billion worth of goods and services and imported $383.0 billion. The difference — $55.9 billion — is that month's trade deficit. Breaking it down further, the goods side ran an $83.7 billion deficit, while services ran a $27.8 billion surplus, netting to the $55.9 billion headline figure.
How the Trade Deficit Is Measured
The US Census Bureau and Bureau of Economic Analysis (BEA) jointly publish the US International Trade in Goods and Services report roughly five weeks after each reference month. It's one of the more market-moving releases on the economic calendar because it feeds directly into quarterly GDP calculations — a wider deficit subtracts from GDP; a narrower one adds to it.
Key mechanics worth knowing:
- Figures are seasonally adjusted to smooth out predictable swings, like the pre-holiday import surge each fall.
- The report distinguishes nominal (current dollar) from real (inflation-adjusted, chained-dollar) figures — real figures are what economists use to judge whether trade volumes are actually changing versus just prices.
- Country-level and commodity-level detail is only revised annually, not monthly, so month-to-month country comparisons can shift when annual revisions land.
The 2026 Turnaround, in Numbers
This is the part most explainers on this topic are missing, because it happened recently:
| Month (2026) | Goods & Services Deficit | Goods Deficit | Services Surplus |
|---|---|---|---|
| January | $54.5B | $81.8B | $27.3B |
| February | $57.3B | $84.6B | $27.3B |
| March | $56.6B (revised) | $88.7B | $28.4B |
| April | $55.9B | $83.7B | $27.8B |
Source: BEA/Census Bureau FT-900 releases
For context, the full-year 2025 deficit was roughly $900 billion — among the largest since 1960 — but that masked a sharp mid-year turn: imports surged in the first half of 2025 as businesses rushed to beat new tariffs, then fell hard once those tariffs took effect. By early 2026, that unwind had cut the year-to-date deficit nearly in half versus the same months of 2025, with April exports of $327.1 billion setting a new monthly record.
What's driving the shrinkage:
- Tariff-driven import pullback. Businesses front-loaded imports ahead of tariffs, then cut back sharply once the higher duties applied.
- Record exports. Capital goods (computers, civilian aircraft), industrial supplies, and energy exports all posted gains, aided in part by higher global energy prices tied to Middle East tensions.
- Energy price effects. Rising oil and gas prices pushed up the dollar value of both US energy exports and imports simultaneously — a reminder that a shrinking deficit isn't always about volume.
Which Countries Make Up the Deficit
Bilateral trade gaps look different depending on the time window, but over the twelve months through April 2026, the largest goods deficits were with:
- Vietnam (~$198 billion, about 19% of the total goods deficit)
- Mexico (~$196 billion, about 19%)
- Taiwan (~$186 billion, about 18%)
- China — historically the single largest bilateral deficit, though tariffs and supply-chain shifts have pushed sourcing toward Vietnam, Mexico, and India, narrowing China's individual share even as total imports from Asia stay elevated.
On the surplus side, the US runs consistent goods surpluses with the Netherlands, United Kingdom, and Hong Kong — a reminder that the trade picture isn't a simple "US vs. the world" story but a web of bilateral flows shaped by re-exporting hubs, financial centers, and specific industries.
China's shifting role deserves its own note: even as the direct bilateral gap narrows, China's dominance in battery manufacturing continues to shape global supply chains and pricing well beyond its own trade numbers — a dynamic explored in more depth in this breakdown of China's battery overcapacity.
What's Actually Driving the Deficit, Beyond Trade Policy
Trade policy gets the headlines, but several structural forces matter just as much:
- Consumer demand. A strong US economy means Americans buy more — including more imported goods. Counterintuitively, a healthy domestic economy tends to widen the deficit, not shrink it.
- The dollar's strength. A strong dollar makes imports cheaper and exports pricier for foreign buyers, pushing the gap wider.
- Manufacturing offshoring. Decades of moving production overseas mean the US now structurally imports goods it once made domestically.
- The energy transition. Batteries, rare earth materials, and EV components are import-heavy categories, even as US shale energy production has reduced dependence on imported crude oil.
- Aerospace competitiveness. Aerospace is one of the few sectors where the US runs a reliable surplus, but that lead isn't guaranteed — shifts in Airbus jet deliveries relative to Boeing's production have direct implications for how large that surplus stays.
- Geopolitical chokepoints. Roughly a fifth of the world's oil moves through the Strait of Hormuz, and any disruption there ripples straight into US import costs — a risk explained in more detail in this look at the Strait of Hormuz and its role in global energy trade.
Do Tariffs Actually Close the Trade Gap?
The 2025–2026 experience gives a real-world test case. The short answer: partially, and at a cost.
What tariffs did:
- Sharply reduced import volumes once they took effect, which is the biggest single factor behind the 2026 deficit narrowing.
- Shifted sourcing away from China toward Vietnam, Mexico, and Taiwan — though those countries now carry larger shares of the deficit themselves.
What tariffs didn't do:
- Eliminate the deficit — the US still ran a substantial gap even at its narrowest 2026 point.
- Avoid side effects — businesses front-loaded imports ahead of tariff deadlines (temporarily widening the deficit before it narrowed), and higher input costs for US manufacturers can weigh on export competitiveness.
- Escape retaliation — trading partners typically respond with their own tariffs on US exports, particularly agriculture.
The historical pattern — tariffs redirecting where goods come from more than whether they're imported at all — still largely holds, even in a year with an unusually large headline swing.
Is a Trade Deficit Actually Bad?
Most mainstream economists don't treat a deficit as inherently harmful — it depends on what's driving it.
Reasonable to live with:
- It reflects strong consumer purchasing power.
- Foreign capital inflows are funding productive US investment, not just consumption.
- Services surpluses are offsetting part of the goods gap.
Worth watching closely:
- Strategic dependence on foreign suppliers for semiconductors, pharmaceuticals, or defense-related components.
- A deficit driven by chronically weak exports rather than strong demand.
- Financing the gap through rising debt in a way that becomes harder to sustain.
Trade Deficit vs. Trade Balance vs. Current Account: Know the Difference
These terms get used interchangeably, but they're not the same thing:
- Trade balance — exports minus imports of goods and services. A negative trade balance is the trade deficit.
- Trade deficit — specifically the goods-and-services shortfall described throughout this article.
- Current account deficit — a broader measure that includes the trade balance plus net investment income (interest, dividends earned abroad vs. paid out) and transfer payments (like foreign aid). A country can have a trade deficit and a current account surplus, or vice versa, depending on investment flows.
Practical Example: Reading a BEA Release Like an Analyst
When the next FT-900 report drops, here's how to read it in under two minutes:
- Check the headline deficit and whether it widened or narrowed from the prior month.
- Split goods from services. A narrowing driven by services usually reflects travel/tourism trends; a shift in goods usually reflects tariffs, energy prices, or consumer demand.
- Look at real vs. nominal. If the nominal deficit moved a lot but the real (inflation-adjusted) figure barely budged, prices — not actual trade volume — are doing the work.
- Scan the country table for outsized moves — a sudden jump with one country often reflects a single large shipment category (aircraft, gold, semiconductors) rather than a broad trend.
- Compare year-to-date, not just the single month. Monthly trade data is volatile; the year-to-date percentage change tells you whether there's a real trend underway.
Common Mistakes to Avoid
- Treating the deficit as a scoreboard. Countries can run deficits for decades while growing strongly; a deficit is not automatically "losing."
- Assuming tariffs are a quick fix. They shift sourcing more reliably than they shrink total import volume.
- Ignoring the services surplus. Focusing only on goods paints an incomplete picture of US trade competitiveness.
- Confusing the trade deficit with the federal budget deficit. They're related in some economic models but are measured completely differently and shouldn't be used interchangeably in analysis.
- Reading one month as a trend. A single month's spike is often a timing artifact (e.g., a large aircraft order or gold shipment), not a structural shift.
The Bottom Line
The US trade deficit isn't a fixed feature of the economy — 2026 proved that it can move fast when tariff policy, energy prices, and consumer demand all shift at once. But the underlying structure hasn't changed: the US still runs a large goods deficit offset by a smaller services surplus, still depends on a handful of trading partners for the bulk of that gap, and still faces the same tradeoff it always has — cheaper imports and consumer choice on one side, manufacturing capacity and strategic supply-chain independence on the other. Watching the monthly BEA release, and reading it the way outlined above, is the most reliable way to tell whether the 2026 narrowing is a lasting shift or a temporary tariff-timing effect.
FAQs
What is the current US trade deficit?
As of April 2026, the monthly goods and services deficit was $55.9 billion, down from $56.6 billion in March. Year-to-date, the deficit was running about 49% below the same period in 2025.
Why did the US trade deficit shrink so much in 2026?
Mainly tariff-driven import pullbacks after businesses front-loaded purchases in 2025 to beat the new duties, combined with record US export levels in capital goods and energy.
Which country does the US have the largest trade deficit with?
Over the twelve months through April 2026, Vietnam, Mexico, and Taiwan each represented larger shares of the goods deficit than China, reflecting years of supply-chain shifts away from direct China sourcing — though China remains a major factor overall.
Does a trade deficit hurt the US economy?
Not automatically. It often reflects strong consumer demand and a resilient currency. The bigger concern is what the deficit is made of — chronic dependence on foreign suppliers for strategic goods is a different problem than Americans simply buying more because incomes are rising.
How do tariffs affect the trade deficit?
They can meaningfully reduce import volumes, as seen in 2026, but they typically redirect sourcing to other countries rather than eliminating the underlying demand for imports, and they invite retaliatory tariffs on US exports.
What's the difference between the trade deficit and the current account deficit?
The trade deficit covers goods and services only. The current account deficit is broader, adding in investment income and transfer payments, and can move in a different direction than the trade balance in a given period.